You are here
Interactive simulations in chemical engineering
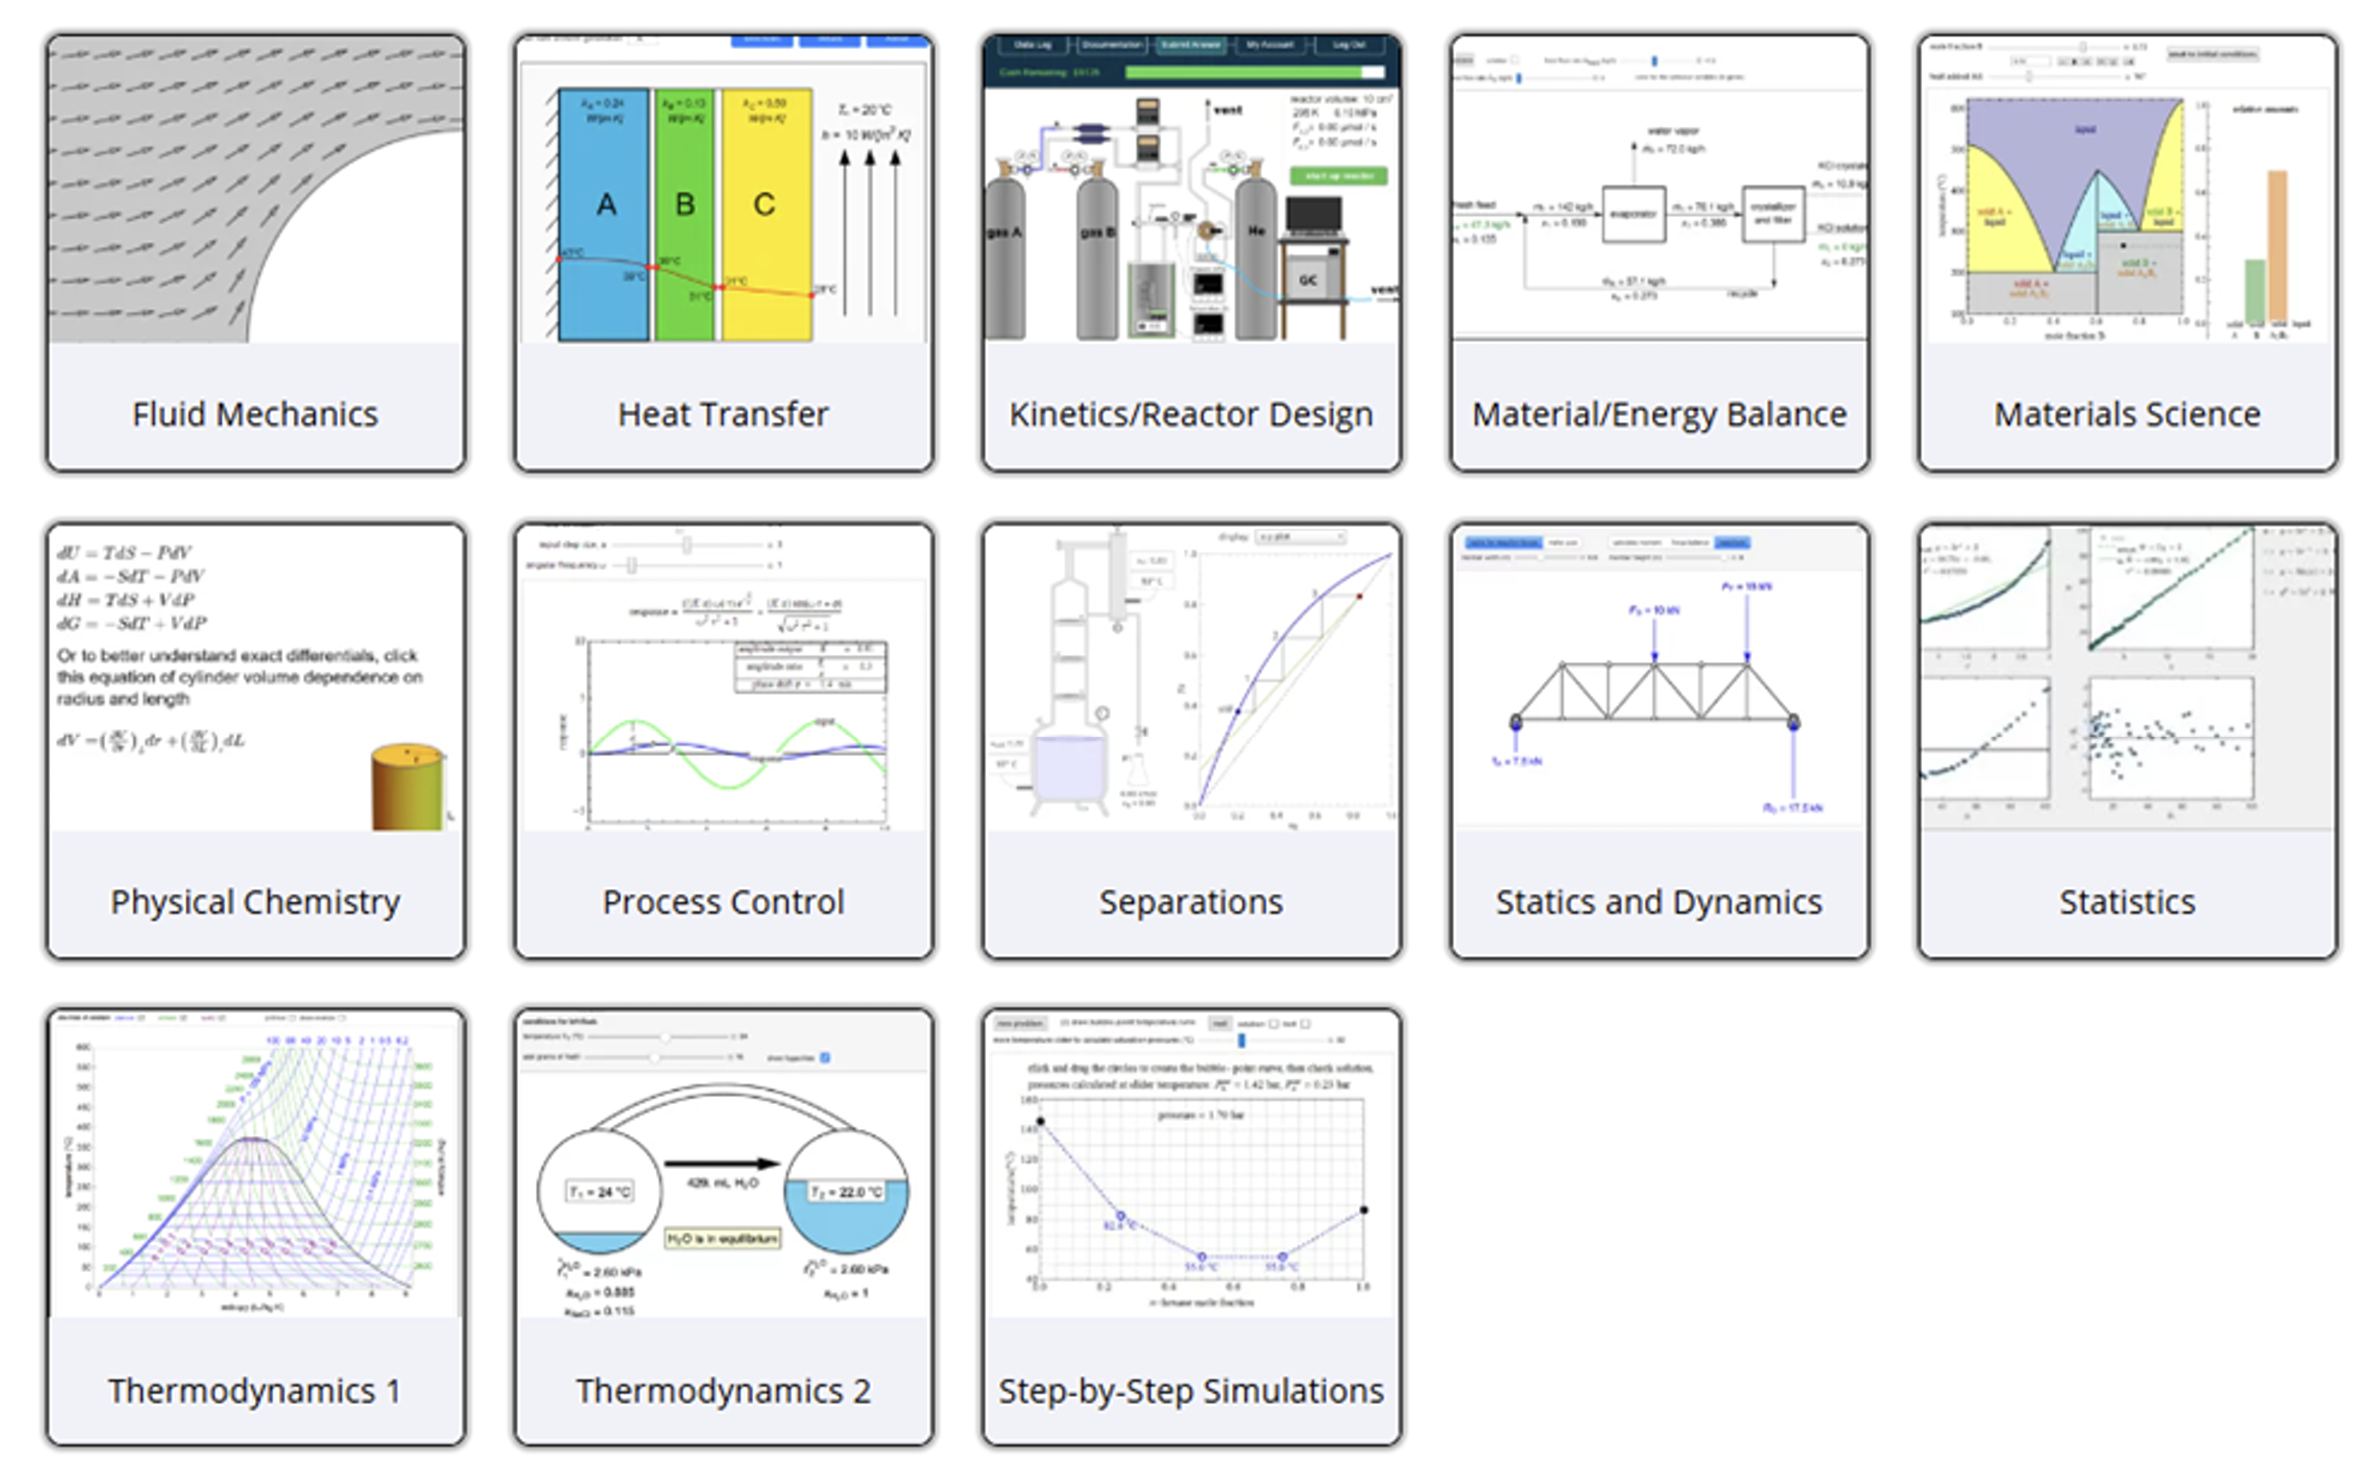
More than 300 interactive simulations are available on the LearnChemE website https://learncheme.com/simulations/. These simulations had 400,000 page views in the last year. More than half of these simulations play directly in browsers on laptops or tablets. The others require a free CDF player from Wolfram (https://www.wolfram.com/player/). Most interactive simulations have short screencasts that demonstrate how to use the simulations. Many simulations are also incorporated into self-study modules on the LearnChemE website. Interactive simulations are available for most core chemical engineering courses, as show in Figure 1. The simulations allow students to change parameters and instantaneously see how the system responds. In most cases, students change parameters with sliders, and in some cases, they move points on a graph. Essentially all simulations contain either a graphical display or animation of a process. Three types of simulations are available. Most simulations demonstrate a concept or show how to use a diagram. Thirty-four simulations are digital or virtual experiments that allow users to collect and analyze data. Twenty simulations are quiz simulations that lead 1 students through step-by-step procedures where they input answers and receive feedback in each step.
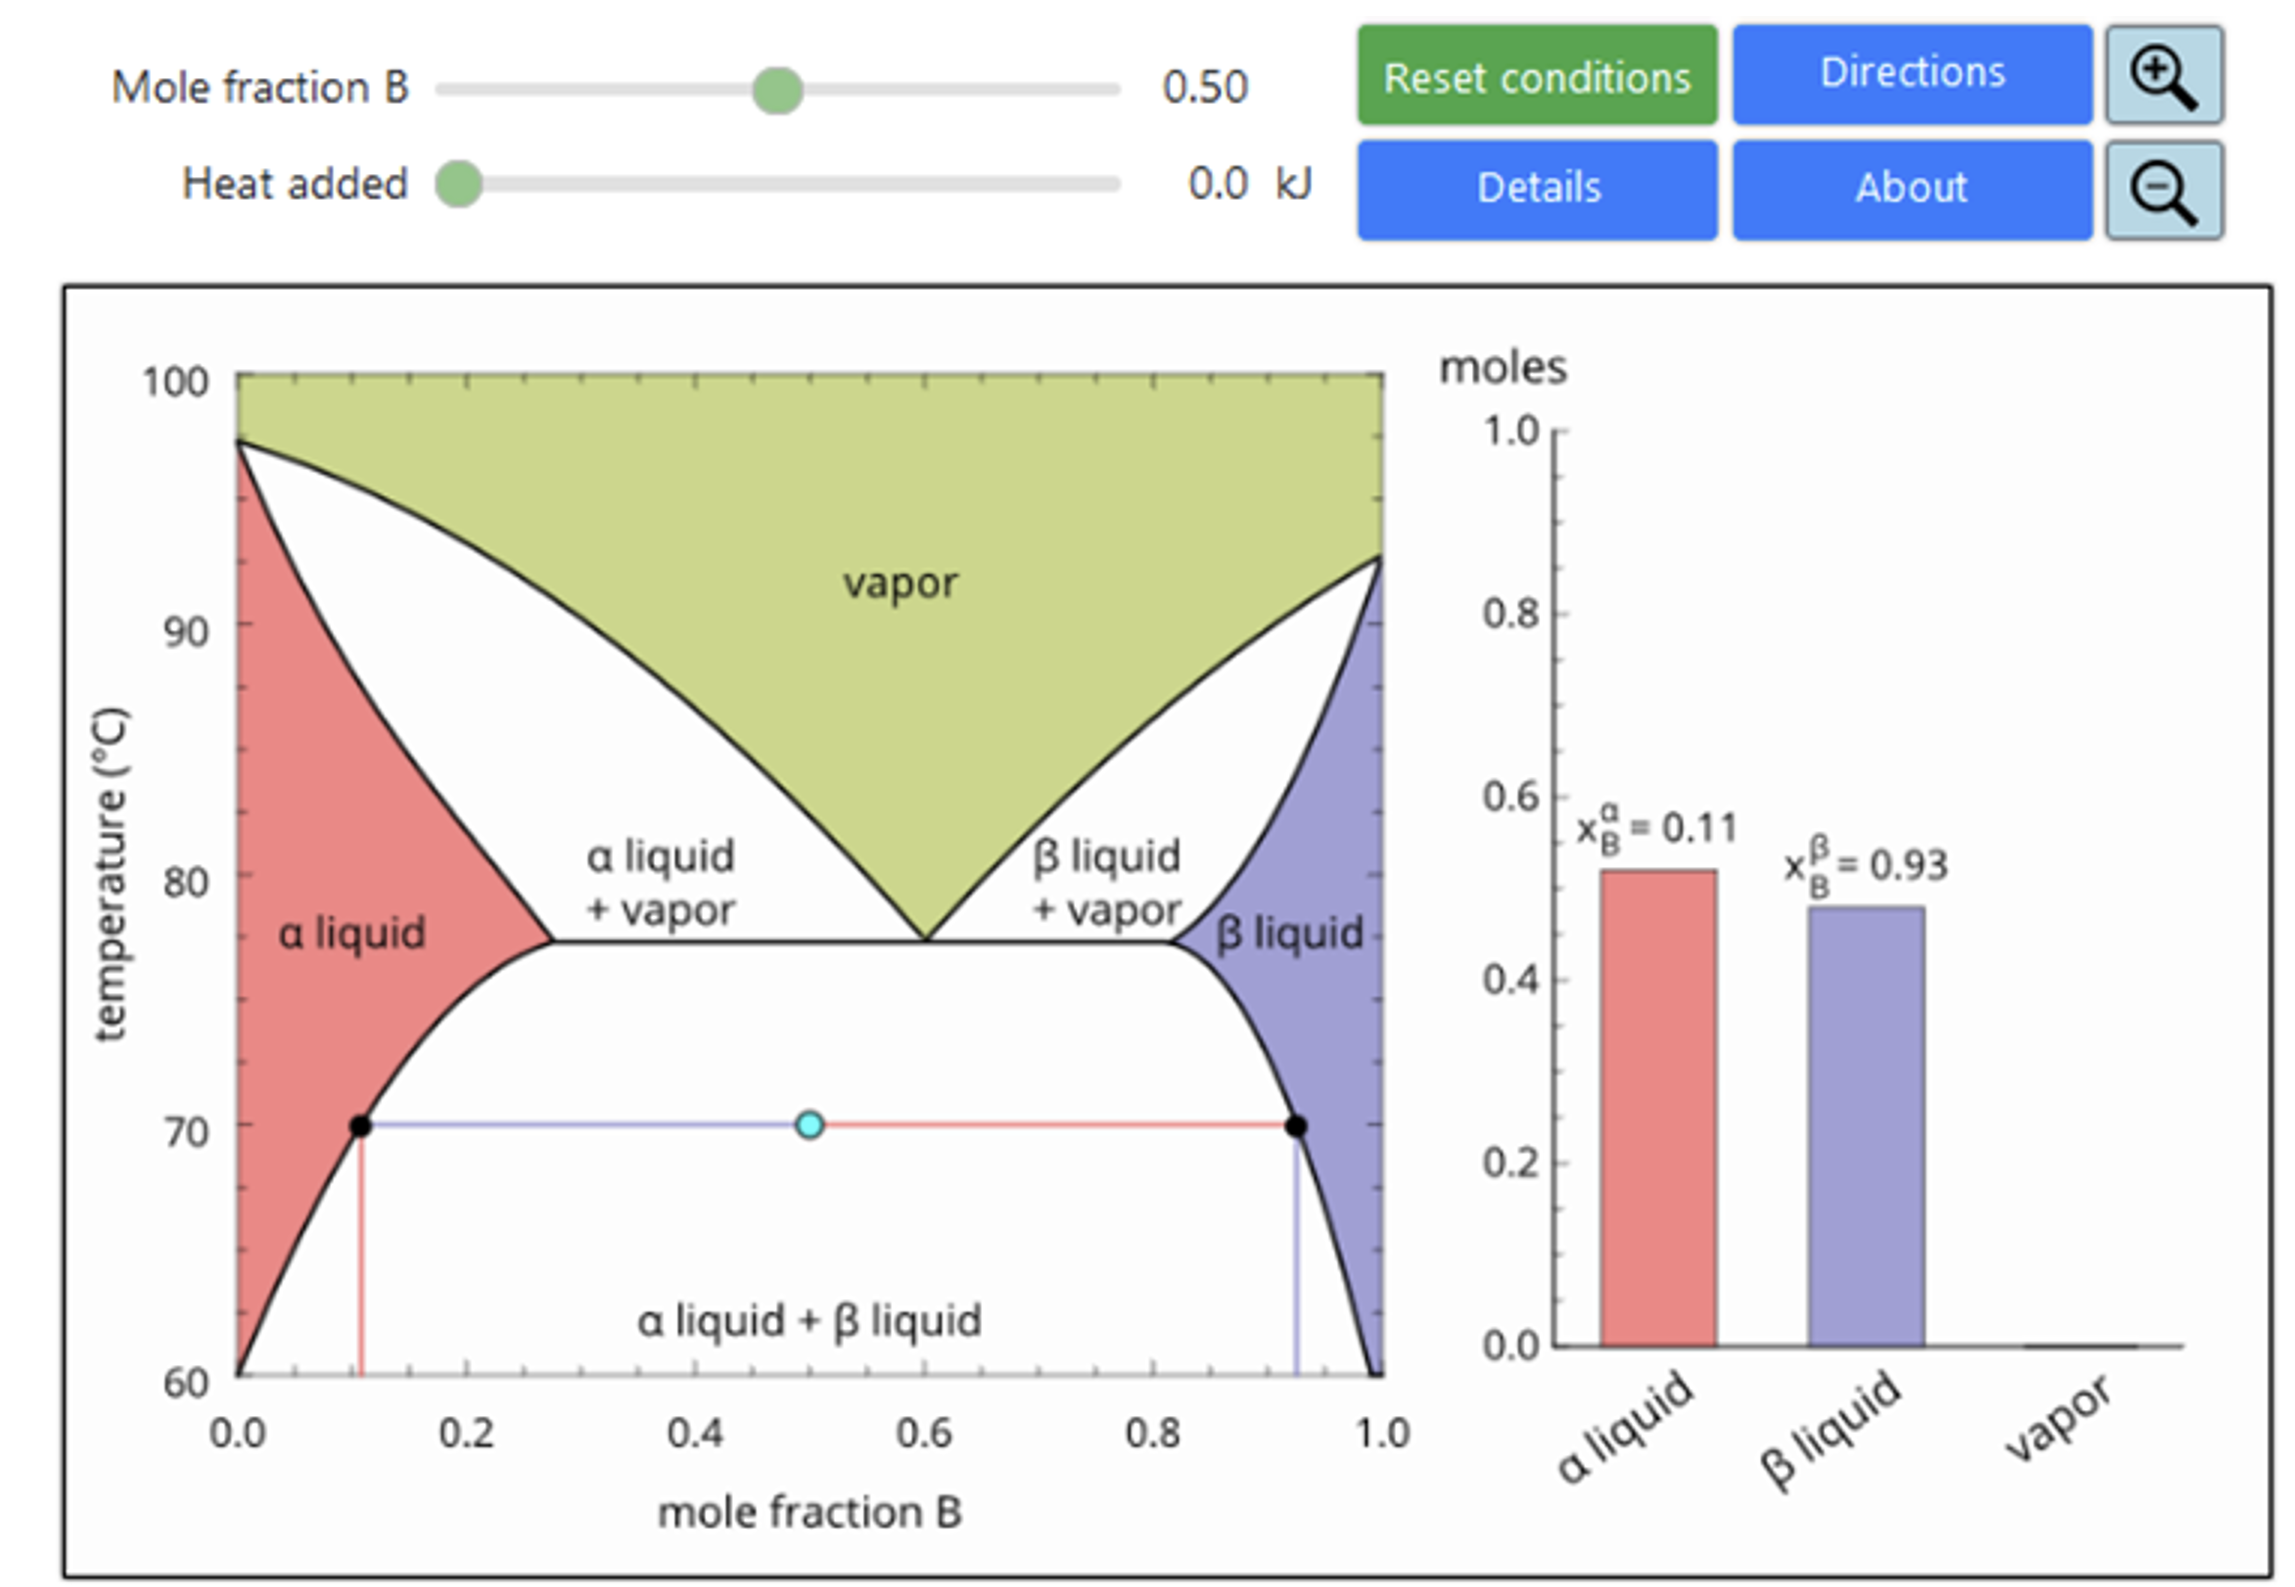
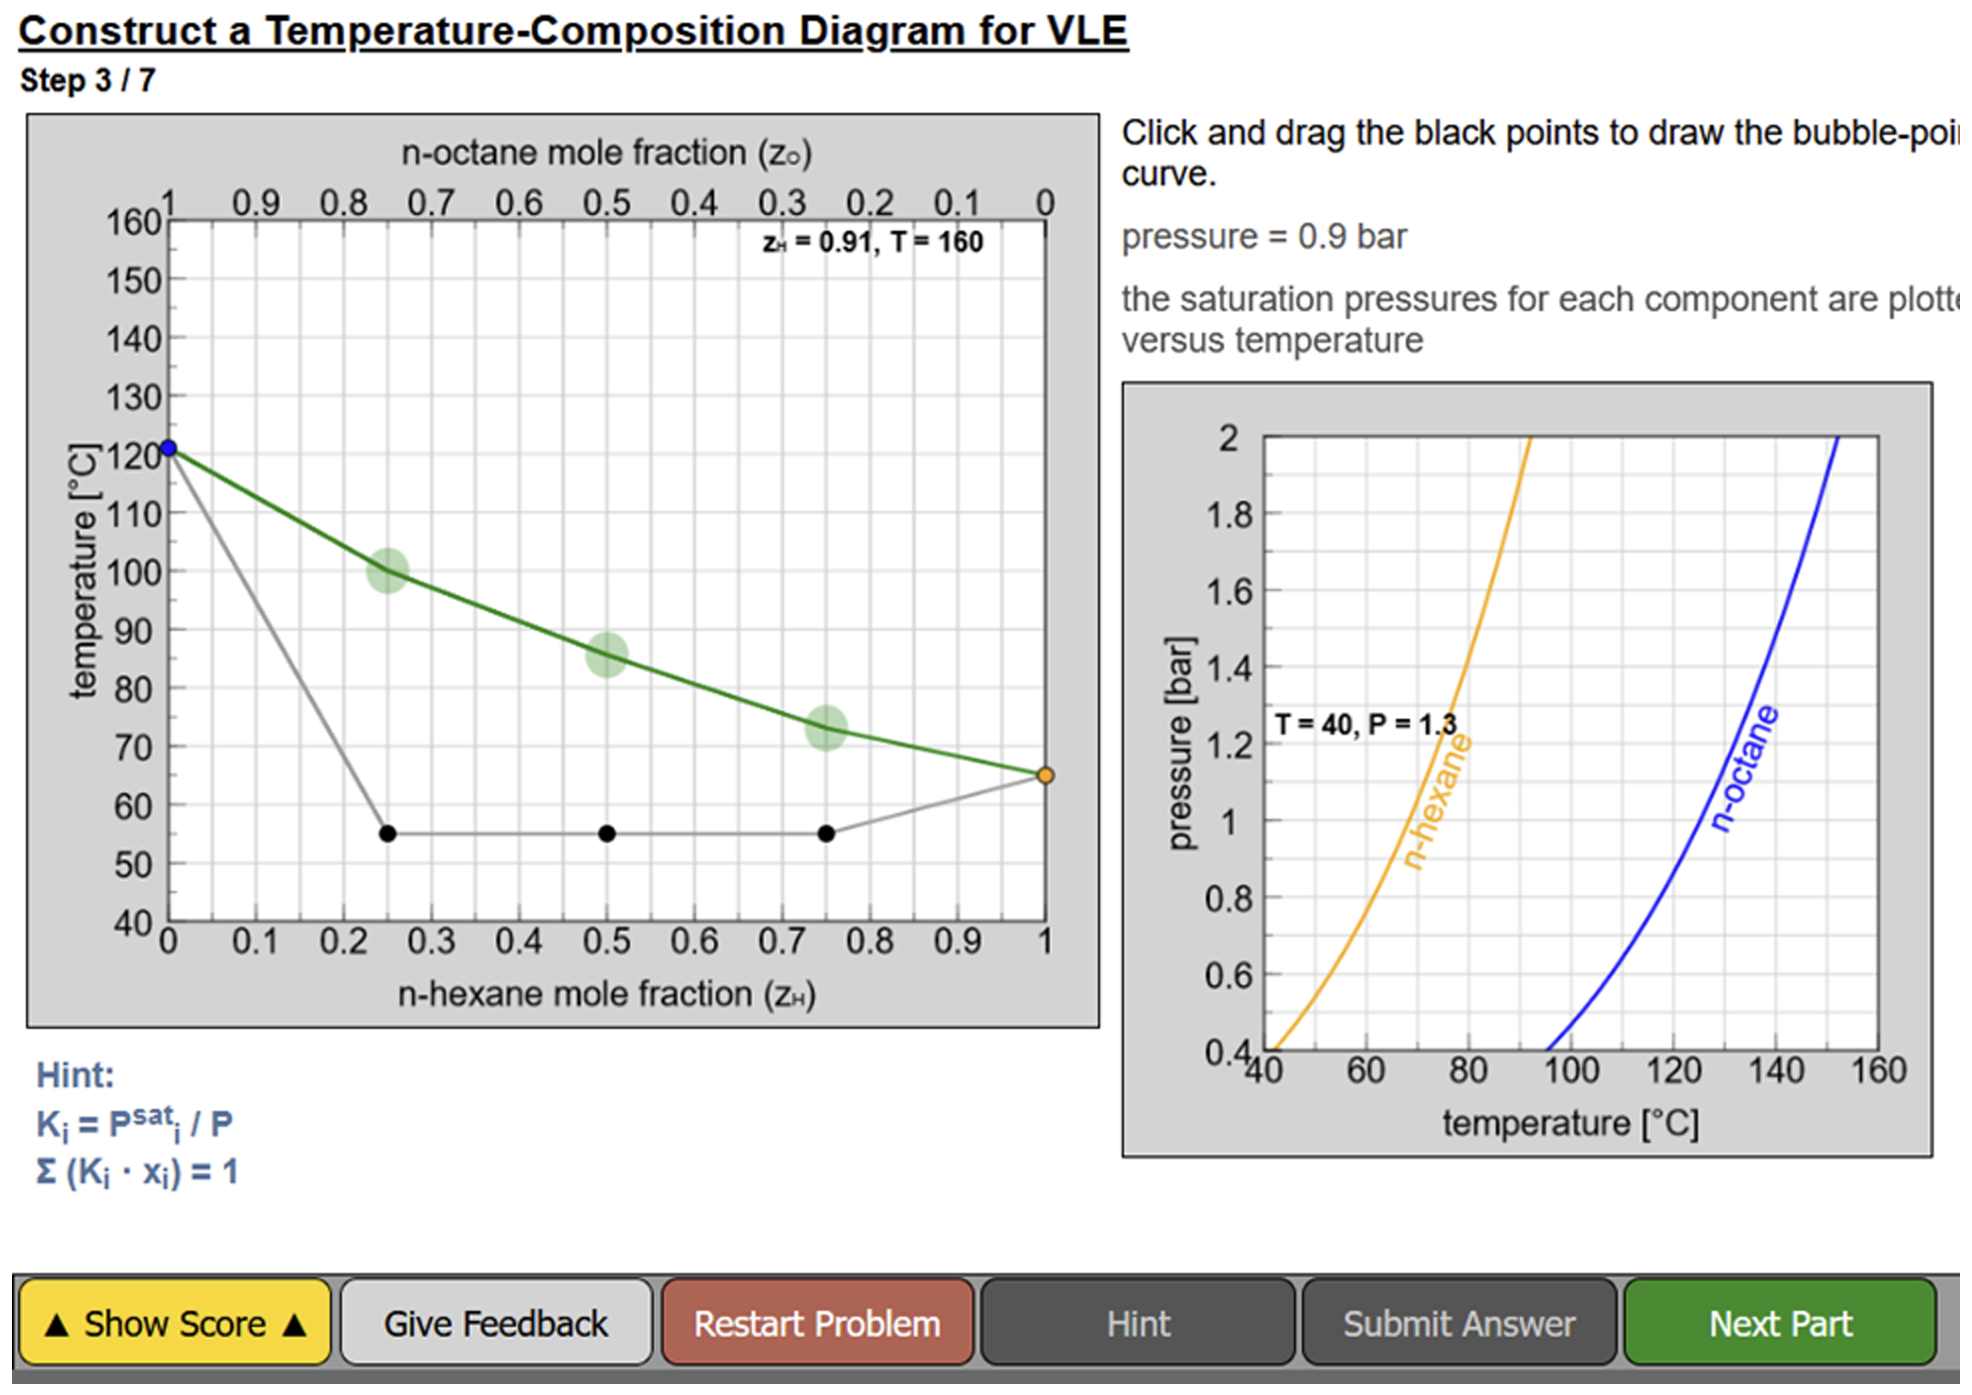
Simulations allow students to observe behavior that can be difficult to observe in a laboratory. Simulations have been used extensively in physics [1-3], and studies have shown that student interactions with simulations have positive effects on learning.[4–6] For example, in one study 80% of students who used a simulation demonstrated mastery of a concept; only 20% of students did so in a course using traditional instruction. They promote self-directed inquiry and exploration.[7] Many simulations demonstrate how to use diagrams. The static nature of diagrams in textbooks can make understanding of diagrams challenging for students. For example, Figure 2 shows a phase diagram for vapor-liquid-liquid equilibrium for a binary mixture with partial miscibility. This diagram is incorporated into an interactive simulation that allows students to move a point on the diagram by selecting an overall mole fraction and then adding heat to the system and observing Figure 2 Snapshot of an interactive simulation of a vapor-liquid-liquid phase diagram. how the temperature changes and the amounts of each of three possible phases change. Likewise, diagrams for solid-solid-liquid equilibrium, vapor-liquid equilibrium (both ideal and non-ideal), and immiscible liquids are available on the LearnChemE website. Quiz simulations are particularly useful in explaining phase diagrams. Figure 3 shows a quiz simulation for a T-x-y diagram for an ideal binary mixture. In this simulation, students proceed step by step to create the diagram. The simulation asks them to locate points on the diagram and after they submit their answer, the simulation provides the correct answer, and presents the next step.
Interactive simulations can be used in class to demonstrate concepts and as part of ConcepTests with student-held clickers. They can also be incorporated into homework assignments. Feedback from students about interactive simulations has been positive. Some of the enthusiastic comments from students in a thermodynamics course are:
- “These interactive simulations were amazing!”
- “Really liked the simulations. You should use more of these.”
- “The interactive simulations are extremely useful.”
- “The interactive simulations were the best thing that could even imagine.”
- “The simulations were very helpful to me. I'm a visual learner, so lectures don't always stick but diagrams always have been very helpful."
- “The interactive simulations are incredibly useful in understanding the material, especially vapor-liquid equilibrium and vapor liquid-liquid equilibrium.”
- “I enjoyed using the interactive simulations. Thought they provided an excellent visual learning tool that added tremendous value to the class.”
- “The interactive simulations were very useful because I could test every scenario on my own rather than just seeing a few general ones.”
Acknowledgments
These simulations were developed with funding from the National Science Foundation and the College of Engineering and Applied Sciences at the University of Colorado Boulder.
References
- Wieman, CE, Adams, WK and Perkins, KK (2008) PhET: simulations that enhance learning. Science 322: 682–683.
- Wieman, CE and Perkins, KK (2006) A powerful tool for teaching science. Nature Phys. 2: 290 292.
- PhET: Free online physics, chemistry, biology, earth science and math simulations (2018). University of Colorado Boulder at https://phet.colorado.edu accessed April 28, 2019
- Bodemer, D, Ploetzner, R, Feuerlein, I and Spada, H (2004) The active integration of information during learning with dynamic and interactive visualisations. Learn. Instr. 14: 325–341.
- van der Meij, J and de Jong, T (2006) Supporting students’ learning with multiple representations in a dynamic simulation-based learning environment. Learn. Instr. 16: 199–212.
- Kadiyala, M and Crynes, BL (2000) A review of literature on effectiveness of information technology in education. J. Eng. Ed. 89: 33–37.
- Podolefsky, NS, Perkins, KK and Adams, WK (2010) Factors promoting engaged exploration with computer simulations. Phys. Rev. Spec. Top. - Phys. Educ. Res. 6: 020117.


Theme by Danetsoft and Danang Probo Sayekti inspired by Maksimer